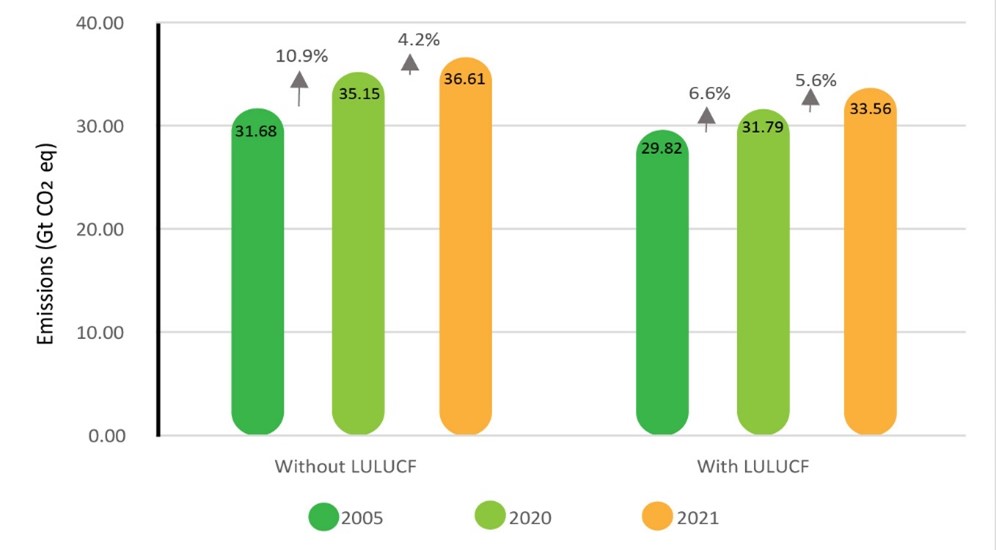
The BTR1s of some developing country Parties contain limited data on trends in GHG emissions, stemming from their lack of data and capacity to compile comprehensive GHG inventories. The information on GHG trends presented in the report is based on submissions from 105 Parties. Because quantitative data were not available for all Parties for the entire time series, data are presented for 81 Parties, representing 63 per cent of global emissions in 2021, and only for 2005, 2020 and 2021. For this group of 81 Parties, total aggregate GHG emissions without LULUCF increased by 15.6 per cent between 2005 and 2021, rising from 31.68 to 36.61 Gt CO2 eq. This growth was driven by factors such as increased economic activity following the Covid-19 pandemic, population growth, and expansion of industrial and agricultural activities.
Total greenhouse gas emissions in 2005, 2020 and 2021 for 81 Parties
Credit: UN Climate Change
Emissions for 105 Parties increased by 4.0 per cent (without LULUCF) between 2020 and 2021, primarily due to post-pandemic surge in economic activity driven largely by domestic transport and power generation.
Total greenhouse gas emissions in 2020 and 2021 for 105 Parties
Credit: UN Climate Change
Note: The totals presented in this figure refer to 105 Parties that reported information for both 2020 and 2021.
The energy sector remained the single largest contributor to total GHG emissions in all reported years (2005, 2020, and 2021), experiencing the largest absolute increase in emissions by 3.0 Gt CO2 eq (or 12.3 per cent) between 2005 and 2021. While the agriculture sector was the second largest source in 2005 and 2020, emissions from the Industrial Processes and Product Use (IPPU) sector surpassed agriculture in 2021, largely due to increased industrial activity following the pandemic. The IPPU sector saw the largest relative increase between 2005 and 2021, rising by 50.8 per cent. Net removals from LULUCF showed a significant increase of 63.4 per cent over 2005–2021 (from 1.87 to 3.05 Gt CO2 eq), primarily due to reduced land clearing and the implementation of deforestation control plans. However, the net removals decreased by 9.2 per cent between 2020 and 2021 due to factors like soil carbon decay and the ageing of forests.
Total greenhouse gas emissions in 2005, 2020 and 2021 for 81 Parties, by sector
Credit: UN Climate Change
The BTR1s also provide limited data on GHG projections to 2030 and 2035. Only 53 Parties, including the EU and 23 of its member States, reported GHG projections, representing 31.7 per cent of total GHG emissions in 2020, and several developing country Parties chose to apply flexibility to reporting projections owing to capacity constraints.
The synthesis of GHG projections for 2030, which is based on submissions from 30 Parties and includes the projections reported by the EU that represents its member States, indicates that current and planned mitigation actions are projected to lead to a decrease in aggregate emissions. Parties reported GHG projections under two main scenarios: 'with measures' (WM) and 'with additional measures' (WAM).
Under the WM scenario, which includes the effect of adopted and implemented PaMs, aggregate GHG emissions (excluding LULUCF) are expected to be 8.0 per cent below 2020 levels by 2030. This projected GHG emissions are further reduced to 11.5 per cent below the 2020 level in 2030 under the adjusted WAM scenario, which includes planned PaMs in addition to adopted and implemented ones. Thus, the implementation of planned PaMs under the WAM scenario is estimated to result in an additional GHG emission reduction of 565.1 Mt CO2eq in 2030 beyond the reductions achieved under the WM scenario.
Historical and projected greenhouse gas emissions of Parties, without land use, land-use change and forestry, under the ‘with measures’ and ‘with additional measures’ scenarios
Credit: UN Climate Change
Note: An adjusted WAM scenario was used for the analysis.
The energy sector (excluding transport) is projected to achieve the largest reduction in emissions by 2030 under the WM scenario, with a decrease of 32.4 per cent compared to 2020 levels. The energy sector (including transport) is expected to remain the dominant source, contributing 76.4 per cent of total emissions without LULUCF in 2030. Despite overall reductions, projections under the WM scenario indicate that emissions from the IPPU, agriculture, and waste sectors are all projected to increase by 3.8, 1.0, and 0.4 per cent, respectively, compared to 2020 levels. Net removals from the LULUCF sector are expected to decrease by 6.9 per cent.
Historical and projected greenhouse gas emissions and removals of Parties under the ‘with measures’ scenario, by sector
Credit: UN Climate Change